 Wawa-news.com Local and Regional News
Alamos Gold Inc.today reported its financial results for the quarter ended June 30, 2019.
“Our operations performed well across the board in the second quarter. Gold production was in line with guidance while total cash costs were down 16% year-over-year, driving stronger margins and record cash flow from operations. This was highlighted by another record quarter of production from Island Gold where we continue to see excellent exploration results. With solid first half performance, we are well positioned to meet full year production and cost guidance,” said John A. McCluskey, President and Chief Executive Officer.
“The lower mine expansion at Young-Davidson is progressing well and construction activities at our Cerro Pelon and Kirazlı projects continue. Each remain on track and we are now less than a year away from starting to see the benefit from these projects through strong free cash flow growth,” Mr. McCluskey added.
Second Quarter 2019
- Produced 125,200 ounces of gold, in-line with guidance and the second quarter of 2018
- Record gold production of 39,500 ounces at Island Gold. This marks the third consecutive quarter of record production, driving mine-site free cash flow of $11.7 million at Island Gold. Through the first half of 2019, Island Gold produced 75,100 ounces and generated $28.3 million of mine-site free cash flow1
- Achieved underground mining rates of 6,700 tonnes per day (“tpd”) at Young-Davidson, and produced 45,000 ounces of gold, consistent with annual guidance
- Record cash flow from operating activities of $72.3 million ($69.7 million, or $0.18 per share, before changes in working capital1), reflecting higher operating margins driven by lower costs, and higher gold sales
- Consolidated total cash costs1 of $699 per ounce were below the low end of guidance, and $133 per ounce, or 16% lower than the second quarter of 2018, driven by low cost production at Island Gold and lower than budgeted costs at Mulatos
- All-in sustaining costs (“AISC”)1 of $926 per ounce, and cost of sales of $1,021 per ounce were both at the low end of annual guidance, and down 7% and 12%, respectively, from the second quarter of 2018
- Sold 128,457 ounces of gold at an average realized price of $1,309 per ounce, in-line with the average London PM Fix, for revenues of $168.1 million
- Reported adjusted net earnings1 of $17.7 million, or $0.05 per share1, which includes adjustments for unrealized foreign exchange gains recorded within both deferred taxes and foreign exchange of $7.1 million, partially offset by other one-time losses totaling $1.2 million
- Realized net earnings of $23.6 million, or $0.06 per share
- Ended the quarter with cash and cash equivalents of $183.2 million and no debt
- Repurchased 0.2 million shares in the quarter, for a total of 2.7 million shares repurchased and canceled during the first half of 2019 at a cost of $11.4 million, or $4.17 per share.
- Received permit approval for the Phase II expansion of Island Gold to 1,200 tpd
- Advanced construction activities at both the Kirazlı project in Turkey and the Cerro Pelon project in Mexico
- Received approval of the environmental impact assessment for La Yaqui Grande project in Mexico during the second quarter and the Change in Land Use permit in July 2019
- Continued to demonstrate exploration success at Island Gold with results from surface exploration drilling further extending high-grade gold mineralization between the Eastern and Main extensions
(1) Refer to the “Non-GAAP Measures and Additional GAAP Measures” disclosure at the end of this press release and associated MD&A for a description and calculation of these measures.
Highlight Summary
| Three Months Ended June 30, | Six Months Ended June 30, | |||||||||||
| 2019 | 2018 | 2019 | 2018 | |||||||||
| Financial Results (in millions) | ||||||||||||
| Operating revenues | $168.1 | $168.9 | $324.2 | $342.0 | ||||||||
| Cost of sales (1) | $131.1 | $150.0 | $258.1 | $294.7 | ||||||||
| Earnings from operations | $28.2 | $9.6 | $46.9 | $28.1 | ||||||||
| Net earnings (loss) | $23.6 | ($8.9 | ) | $40.4 | ($8.3 | ) | ||||||
| Adjusted net earnings (2) | $17.7 | $4.9 | $28.0 | $17.2 | ||||||||
| Cash provided by operations before working capital and cash taxes(2) | $69.7 | $54.7 | $131.4 | $117.3 | ||||||||
| Cash provided by operating activities | $72.3 | $62.5 | $114.7 | $121.3 | ||||||||
| Capital expenditures (sustaining) (2) | $19.6 | $12.1 | $35.7 | $22.8 | ||||||||
| Capital expenditures (growth) (2) | $47.2 | $35.7 | $81.3 | $72.3 | ||||||||
| Capital expenditures (capitalized exploration) (3) | $4.3 | $5.6 | $7.4 | $9.8 | ||||||||
| Operating Results | ||||||||||||
| Gold production (ounces) | 125,200 | 126,500 | 250,500 | 255,400 | ||||||||
| Gold sales (ounces) | 128,457 | 129,272 | 248,162 | 259,317 | ||||||||
| Per Ounce Data | ||||||||||||
| Average realized gold price | $1,309 | $1,307 | $1,306 | $1,319 | ||||||||
| Average spot gold price (London PM Fix) | $1,309 | $1,306 | $1,307 | $1,318 | ||||||||
| Cost of sales per ounce of gold sold (includes amortization) (1) | $1,021 | $1,160 | $1,040 | $1,136 | ||||||||
| Total cash costs per ounce of gold sold (2) | $699 | $832 | $715 | $811 | ||||||||
| All-in sustaining costs per ounce of gold sold (2) | $926 | $996 | $941 | $966 | ||||||||
| Share Data | ||||||||||||
| Earnings (loss) per share, basic and diluted | $0.06 | ($0.02 | ) | $0.10 | ($0.02 | ) | ||||||
| Adjusted earnings per share, basic and diluted (2) | $0.05 | $0.01 | $0.07 | $0.04 | ||||||||
| Weighted average common shares outstanding (basic) (000’s) | 389,218 | 389,602 | 389,475 | 389,429 | ||||||||
| Financial Position (in millions) | ||||||||||||
| Cash and cash equivalents (4) | $183.2 | $235.1 | ||||||||||
(1) Cost of sales includes mining and processing costs, royalties, and amortization expense.
(2) Refer to the “Non-GAAP Measures and Additional GAAP Measures” disclosure at the end of this press release and associated MD&A for a description and calculation of these measures.
(3) Includes capitalized exploration at Mulatos and Island Gold.
(4) Comparative cash and cash equivalents balance as at December 31, 2018.
| Three Months Ended June 30, | Six Months Ended June 30, | |||||||||||
| 2019 | 2018 | 2019 | 2018 | |||||||||
| Gold production (ounces) | ||||||||||||
| Young-Davidson | 45,000 | 39,100 | 90,000 | 80,100 | ||||||||
| Mulatos | 36,300 | 50,600 | 75,200 | 96,600 | ||||||||
| Island Gold | 39,500 | 26,700 | 75,100 | 54,800 | ||||||||
| El Chanate (1) | 4,400 | 10,100 | 10,200 | 23,900 | ||||||||
| Gold sales (ounces) | ||||||||||||
| Young-Davidson | 44,665 | 42,006 | 88,661 | 86,796 | ||||||||
| Mulatos | 40,116 | 49,326 | 76,205 | 93,985 | ||||||||
| Island Gold | 39,300 | 27,257 | 72,885 | 54,760 | ||||||||
| El Chanate (1) | 4,376 | 10,683 | 10,411 | 23,776 | ||||||||
| Cost of sales (in millions)(2) | ||||||||||||
| Young-Davidson | $57.1 | $56.7 | $114.0 | $113.7 | ||||||||
| Mulatos | $35.8 | $49.2 | $69.6 | $92.8 | ||||||||
| Island Gold | $32.4 | $28.0 | $61.0 | $55.5 | ||||||||
| El Chanate | $5.8 | $16.1 | $13.5 | $32.7 | ||||||||
| Cost of sales per ounce of gold sold (includes amortization) | ||||||||||||
| Young-Davidson | $1,278 | $1,350 | $1,286 | $1,310 | ||||||||
| Mulatos | $892 | $997 | $913 | $987 | ||||||||
| Island Gold | $824 | $1,027 | $837 | $1,014 | ||||||||
| El Chanate | $1,325 | $1,507 | $1,297 | $1,375 | ||||||||
| Total cash costs per ounce of gold sold (3) | ||||||||||||
| Young-Davidson | $822 | $890 | $830 | $856 | ||||||||
| Mulatos | $725 | $795 | $734 | $791 | ||||||||
| Island Gold | $473 | $587 | $484 | $570 | ||||||||
| El Chanate | $1,234 | $1,404 | $1,210 | $1,279 | ||||||||
| Mine-site all-in sustaining costs per ounce of gold sold (3),(4) | ||||||||||||
| Young-Davidson | $1,077 | $1,083 | $1,073 | $1,037 | ||||||||
| Mulatos | $815 | $854 | $812 | $848 | ||||||||
| Island Gold | $631 | $668 | $639 | $650 | ||||||||
| El Chanate | $1,257 | $1,442 | $1,220 | $1,304 | ||||||||
| Capital expenditures (sustaining, growth and capitalized exploration) (in millions)(3) | ||||||||||||
| Young-Davidson | $26.7 | $18.5 | $49.0 | $41.4 | ||||||||
| Mulatos(5) | $19.2 | $9.5 | $31.8 | $16.7 | ||||||||
| Island Gold (6) | $18.0 | $17.6 | $30.4 | $31.5 | ||||||||
| El Chanate | $— | $0.2 | $— | $0.3 | ||||||||
| Other | $7.2 | $7.6 | $13.2 | $15.0 | ||||||||
(1) El Chanate ceased mining activities in October 2018 and transitioned to residual leaching.
(2) Cost of sales includes mining and processing costs, royalties and amortization.
(3) Refer to the “Non-GAAP Measures and Additional GAAP Measures” disclosure at the end of this press release and associated MD&A for a description and calculation of these measures.
(4) For the purposes of calculating mine-site all-in sustaining costs, the Company does not include an allocation of corporate and administrative and share based compensation expenses.
(5) Includes capitalized exploration at Mulatos of $nil for the three and six months ended June 30, 2019 ($0.9 and $2.0 million for the three and six months ended June 30, 2018).
(6) Includes capitalized exploration at Island Gold of $4.3 million and $7.4 million for the three and six months ended June 30, 2019 ($4.7 million and $7.8 million for the three and six months ended June 30, 2018).
Outlook and Strategy
| 2019 Guidance | ||||||||||||||
| Young-Davidson | Mulatos | Island Gold |
El Chanate | Turkey | Other (2) | Total | ||||||||
| Gold production (000’s ounces) | 180-190 | 150-160 | 135-145 | 15-25 | 480-520 | |||||||||
| Cost of sales, including amortization (in millions) (4) |
$226 | $165 | $120 | $26 | — | — | $ 537 | |||||||
| Cost of sales, including amortization ($ per ounce) (4) |
$1,220 | $1,065 | $855 | $1,300 | — | — | $ 1,075 | |||||||
| Total cash costs ($ per ounce) (1) | $750-790 | $820-860 | $460-500 | $1,200 | — | — | $710-750 | |||||||
| All-in sustaining costs ($ per ounce) (1) |
— | — | $920-960 | |||||||||||
| Mine-site all-in sustaining costs ($ per ounce) (1),(3) |
$940-980 | $860-900 | $730-770 | $1,200 | — | — | — | |||||||
| Amortization costs ($ per ounce) (1) |
$450 | $225 | $375(6) | $100 | — | — | $ 345 | |||||||
| Capital expenditures (in millions) | ||||||||||||||
| Sustaining capital(1) | $35-40 | $5 | $35-40 | — | — | — | $75-85 | |||||||
| Growth capital(1) | $45-50 | $45-50 (5) | $15-20 | — | $75 | $35 (2) | $215-230 | |||||||
| Total capital expenditures(1) | $80-90 | $50-55 | $50-60 | — | $75 | $35 | $290-315 | |||||||
(1) Refer to the “Non-GAAP Measures and Additional GAAP” disclosure at the end of this press release and associated MD&A for a description of these measures.
(2) Includes capitalized exploration at all operating sites and development projects (excluding Turkey which is separately disclosed).
(3) For the purposes of calculating mine-site all-in sustaining costs at individual mine sites, the Company does not include an allocation of corporate and administrative and share based compensation expenses to the mine sites.
(4) Cost of sales includes mining and processing costs, royalties, and amortization expense, and is calculated based on the mid-point of guidance.(5) Includes capital spending at Cerro Pelon and La Yaqui Grande of approximately $33 million
(6) Amortization per ounce was updated for Island Gold, reflecting the 2018 Mineral Reserves and Resource Statement released in February 2019.
In the second quarter of 2019, the Company delivered on its strategic objectives through expanding margins and profitability from its existing operations, while advancing its portfolio of low cost development projects. Consolidated production of 125,200 ounces was in line with guidance while total cash costs of $699 per ounce were below the low end of annual guidance and a substantial improvement from the second quarter of 2018. The decrease in total cash costs in the quarter was driven by low cost production growth at Island Gold and higher grades mined at Mulatos. With year-to-date production of 250,500 ounces at total cash costs of $715 per ounce, the Company is well positioned to meet its full year production and cost guidance.
Looking forward, the Company expects third quarter production to be in a similar range as the second quarter. Total cash costs are expected to increase to within the range of annual guidance and all-in sustaining costs are expected to increase to the higher-end of the annual guidance range reflecting higher sustaining capital at Island Gold.
The near-term focus at Young-Davidson remains on maximizing efficiency from the upper mine infrastructure, while completing development and construction of the lower mine. Gold production in the second quarter of 45,000 ounces was consistent with guidance, while underground mining rates increased to over 6,700 tpd, above guidance of 6,500 tpd and the highest level since 2017. With production of 90,000 ounces through the first half of the year, Young-Davidson is on track to meet full year production guidance of 180,000 to 190,000 ounces.
As the lower mine expansion nears completion, approximately three months of downtime of the Northgate shaft is required to facilitate the tie-in of the upper and lower mines. Accordingly, and as previously guided, gold production from Young-Davidson is expected to be lower in the first half of 2020. Following completion of the tie-in in the first half of 2020, underground mining rates are expected to ramp up above 7,500 tpd in the second half of 2020. This is expected to drive annual gold production above 200,000 ounces per year in 2021 and beyond. This production increase, combined with declining costs and capital spending, is expected to result in strong free cash flow growth from Young-Davidson starting in the second half of 2020.
Island Gold produced a record 39,500 ounces of gold in the second quarter for its third consecutive quarter of record production. Year-to-date, Island Gold has produced 75,100 ounces, putting it on track to meet or exceed full year production guidance of 135,000 to 145,000 ounces. Additionally, Island Gold generated $11.7 million of mine-site free cash flow in the second quarter, bringing the first half total to $28.3 million, net of all capital and exploration spending. Island Gold’s sustaining capital spending and mine-site AISC are expected to increase in the second half of 2019, bringing mine-site AISC in-line with annual guidance.
The Phase I expansion at Island Gold was completed in 2018, expanding the mill to a design capacity of approximately 1,200 tpd. During the second quarter, the Company was granted amendments to its existing operating permits allowing for an increase in throughput rates from 1,100 tpd to 1,200 tpd. Underground mining rates are expected to increase to 1,200 tpd in 2020. In parallel, the Company is continuing with a large ongoing exploration program at Island Gold which has been successful in driving significant growth in Mineral Reserves and Resources over the last several years. This growth and ongoing exploration success is being incorporated into a Phase III expansion study of the operation beyond 1,200 tpd.
Production from the Mulatos District totaled 36,300 ounces in the second quarter, bringing the first half total to 75,200 ounces. The operation remains on track to meet annual guidance of 150,000 to 160,000 ounces. Total cash costs and mine-site AISC in the first half of the year have outperformed annual guidance, benefiting from higher grades mined and low-cost concentrate sales. Both costs are expected to return to guided levels in the second half of the year as mining at La Yaqui Phase I winds down.
Construction of the higher grade, high return Cerro Pelon project is advancing on schedule. Development activities during the quarter were focused on construction of the haulage roads, crusher installation, and initial pre-stripping activities. Initial low cost production remains on track for early 2020.
Mining activities ceased at El Chanate in the fourth quarter of 2018 and the operation has transitioned to residual leaching which is anticipated to result in a declining rate of production throughout 2019. El Chanate has generated $2.2 million in free cash flow year-to-date.
Construction at the Kirazlı project in Turkey ramped up during the second quarter. This included advancing construction on the water reservoir and power line, completing clearing and grubbing of the project site and initiating earthworks, with the civil works contractor having mobilized to site in June. Spending at Kirazlı represents the majority of the Company’s development capital budget in 2019. The remaining development capital spending will be comprised of capitalized exploration at Island Gold and exploration, permitting and development activities at Lynn Lake.
The 2019 global exploration budget is $33 million, with $19 million allocated for exploration at Island Gold. Mulatos and Lynn Lake remain the other two areas of focus with $6 million budgeted for each. The Company has spent $12.8 million on exploration activities to date in 2019 and expects to ramp up drilling activities in the second half of the year.
The Company’s long-term strategic objective is to generate increasing free cash flow through low-cost production growth from its existing operations and portfolio of development projects. With $183 million of cash and cash equivalents, no debt, and growing cash flow from its operations, the Company is well positioned to fund its internal growth initiatives.
Second Quarter 2019 Results
Young-Davidson Financial and Operational Review
| Three Months Ended June 30, |
Six Months Ended June 30, |
|||||||||||
| 2019 | 2018 | 2019 | 2018 | |||||||||
| Gold production (ounces) | 45,000 | 39,100 | 90,000 | 80,100 | ||||||||
| Gold sales (ounces) | 44,665 | 42,006 | 88,661 | 86,796 | ||||||||
| Financial Review (in millions) | ||||||||||||
| Operating Revenues | $58.6 | $55.1 | $116.0 | $114.6 | ||||||||
| Cost of sales (1) | $57.1 | $56.7 | $114.0 | $113.7 | ||||||||
| Earnings from operations | $1.5 | ($1.6 | ) | $2.0 | $0.9 | |||||||
| Cash provided by operating activities | $23.6 | $22.5 | $46.5 | $49.9 | ||||||||
| Capital expenditures (sustaining) (2) | $11.2 | $7.9 | $21.2 | $15.5 | ||||||||
| Capital expenditures (growth) (2) | $15.5 | $10.6 | $27.8 | $25.9 | ||||||||
| Mine-site free cash flow (2) | ($3.1 | ) | $4.0 | ($2.5 | ) | $8.5 | ||||||
| Cost of sales, including amortization per ounce of gold sold (1) | $1,278 | $1,350 | $1,286 | $1,310 | ||||||||
| Total cash costs per ounce of gold sold (2) | $822 | $890 | $830 | $856 | ||||||||
| Mine-site all-in sustaining costs per ounce of gold sold (2),(3) | $1,077 | $1,083 | $1,073 | $1,037 | ||||||||
| Underground Operations | ||||||||||||
| Tonnes of ore mined | 612,213 | 553,883 | 1,200,847 | 1,138,943 | ||||||||
| Tonnes of ore mined per day (“tpd”) | 6,728 | 6,087 | 6,635 | 6,293 | ||||||||
| Average grade of gold (4) | 2.42 | 2.35 | 2.48 | 2.36 | ||||||||
| Metres developed | 2,877 | 3,079 | 5,777 | 6,223 | ||||||||
| Mill Operations | ||||||||||||
| Tonnes of ore processed | 683,946 | 598,196 | 1,293,873 | 1,267,483 | ||||||||
| Tonnes of ore processed per day | 7,516 | 6,574 | 7,148 | 7,003 | ||||||||
| Average grade of gold (4) | 2.26 | 2.17 | 2.36 | 2.20 | ||||||||
| Contained ounces milled | 49,661 | 41,798 | 98,176 | 87,992 | ||||||||
| Average recovery rate | 91 | % | 92 | % | 91 | % | 91 | % | ||||
(1) Cost of sales includes mining and processing costs, royalties and amortization.
(2) Refer to the “Non-GAAP Measures and Additional GAAP Measures” disclosure at the end of this press release and associated MD&A for a description and calculation of these measures.
(3) For the purposes of calculating mine-site all-in sustaining costs, the Company does not include an allocation of corporate and administrative and share based compensation expenses.
(4) Grams per tonne of gold (“g/t Au”).
Young-Davidson produced 45,000 ounces of gold in the second quarter of 2019, 15% higher than the comparative quarter of 2018, reflecting higher tonnes and grades mined. The operation remains on track to achieve 2019 guidance with production of 90,000 ounces in the first half of the year.
Underground mining rates of 6,728 tpd were above 2019 guidance, and an 11% improvement from the second quarter of 2018. Mining rates are expected to remain at guided levels of 6,500 tpd until the lower-mine tie-in is completed in the first half of 2020. Underground grades mined of 2.42 g/t Au were lower than annual guidance due to mine sequencing, but improved 3% relative to the second quarter of 2018. Grades mined are expected to increase in the second half of the year, in line with annual guidance.
Mill throughput of 7,516 tpd was higher than the second quarter of 2018, with the prior year impacted by unplanned maintenance which resulted in mill downtime. Milling rates also increased from the first quarter as the operation resumed supplementing underground throughput with low-grade surface stockpiles. Mill throughput in the third quarter will continue to benefit from surface stockpiles until the end of the quarter when the stockpiles are expected to be depleted. Mill throughput will then decline to match underground mining rates. Mill recoveries of 91% in the quarter were in line with guidance.
Financial Review
Second quarter revenues of $58.6 million were 6% above the prior year quarter, reflecting a 6% increase in ounces sold. For the first half of 2019, revenues of $116.0 million were $1.4 million higher than the prior year, attributable to more ounces sold.
Cost of sales (which includes mining and processing costs, royalties, and amortization expense) of $57.1 million were consistent with the comparative quarter of 2018, as were underground mining costs of approximately CAD$53 per tonne. Amortization of $457 per ounce was also consistent with the prior year period and annual guidance. Cost of sales for the first half of 2019 were $114.0 million and consistent with the prior year period.
Total cash costs of $822 per ounce in the second quarter were 7% below the comparative period, but slightly above annual guidance as a result of lower grades mined in the quarter and higher maintenance costs. For the first half of 2019, total cash costs of $830 per ounce were 3% lower than the prior year period. Total cash costs are expected to decrease in the second half of the year reflecting higher underground grades mined.
Mine-site AISC of $1,077 per ounce were in line with the second quarter of 2018 and above 2019 guidance, reflecting the timing of sustaining capital expenditures on the new tailings facility and equipment rebuilds. In the first half of 2019, sustaining capital totaled $21.2 million, or 60% of the full year budget. Mine-site AISC for the six-month period were $1,073 per ounce, or 4% higher than the prior year period due to similar factors. Full year total cash costs and mine-site AISC are both expected to be within 2019 guidance as underground grades mined increase and sustaining capital spending decreases in the second half of the year.
Capital expenditures were $26.7 million in the second quarter. This included $11.2 million of sustaining capital and $15.5 million of growth capital. For the six-month period, capital expenditures of $49.0 million were focused on lower mine construction, lateral development in the upper and lower mines, and construction of the new tailings facility.
Mine-site free cash flow at Young-Davidson was negative $3.1 million in the second quarter, lower than the same period of 2018 due to higher capital spending. On a year-to-date basis mine-site free cash flow was negative $2.5 million. Since 2016, Young-Davidson has generated sufficient cash flow from operations to finance all of its capital spending, including the lower mine expansion. The lower mine expansion remains on track for completion in the first half of 2020.
Island Gold Financial and Operational Review
| Three Months Ended June 30, |
Six Months Ended June 30, |
|||||||||||
| 2019 | 2018 | 2019 | 2018 | |||||||||
| Gold production (ounces) | 39,500 | 26,700 | 75,100 | 54,800 | ||||||||
| Gold sales (ounces) | 39,300 | 27,257 | 72,885 | 54,760 | ||||||||
| Financial Review (in millions) | ||||||||||||
| Operating Revenues | $51.3 | $35.7 | $95.1 | $72.3 | ||||||||
| Cost of sales (1) | $32.4 | $28.0 | $61.0 | $55.5 | ||||||||
| Earnings from operations | $18.7 | $7.7 | $33.7 | $16.7 | ||||||||
| Cash provided by operating activities | $29.7 | $22.0 | $58.7 | $45.7 | ||||||||
| Capital expenditures (sustaining) (2) | $6.2 | $2.2 | $11.3 | $4.4 | ||||||||
| Capital expenditures (growth) (2) | $7.5 | $10.7 | $11.7 | $19.3 | ||||||||
| Capital expenditures (capitalized exploration) (2) | $4.3 | $4.7 | $7.4 | $7.8 | ||||||||
| Mine-site free cash flow (2) | $11.7 | $4.4 | $28.3 | $14.2 | ||||||||
| Cost of sales, including amortization per ounce of gold sold (1) | $824 | $1,027 | $837 | $1,014 | ||||||||
| Total cash costs per ounce of gold sold (2) | $473 | $587 | $484 | $570 | ||||||||
| Mine-site all-in sustaining costs per ounce of gold sold (2),(3) | $631 | $668 | $639 | $650 | ||||||||
| Underground Operations | ||||||||||||
| Tonnes of ore mined | 90,141 | 82,097 | 187,653 | 166,752 | ||||||||
| Tonnes of ore mined per day (“tpd”) | 991 | 902 | 1,037 | 921 | ||||||||
| Average grade of gold (4) | 14.53 | 7.34 | 12.90 | 9.23 | ||||||||
| Metres developed | 1,568 | 1,771 | 2,989 | 3,327 | ||||||||
| Mill Operations | ||||||||||||
| Tonnes of ore processed | 102,803 | 88,776 | 204,800 | 170,881 | ||||||||
| Tonnes of ore processed per day | 1,130 | 976 | 1,131 | 944 | ||||||||
| Average grade of gold (4) | 12.23 | 8.71 | 11.68 | 9.84 | ||||||||
| Contained ounces milled | 40,438 | 24,861 | 76,884 | 54,085 | ||||||||
| Average recovery rate | 97 | % | 97 | % | 97 | % | 96 | % | ||||
(1) Cost of sales includes mining and processing costs, royalties and amortization.
(2) Refer to the “Non-GAAP Measures and Additional GAAP Measures” disclosure at the end of this press release and associated MD&A for a description and calculation of these measures.
(3) For the purposes of calculating mine-site all-in sustaining costs, the Company does not include an allocation of corporate and administrative and share based compensation expenses.
(4) Grams per tonne of gold (“g/t Au”).
Island Gold produced a record 39,500 ounces in the second quarter, the third consecutive quarter of record production. This marked a 48% increase from the second quarter of 2018 driven by higher mining and milling rates and grades mined. The operation realized another strong quarter of mine-site free cash flow, generating $11.7 million in the quarter and bringing the year-to-date total to $28.3 million.
Underground mining rates were 991 tpd in the second quarter, a 10% improvement from the second quarter of 2018. Underground mining rates averaged 1,037 tpd for the first half of the year, and are expected to increase in the second half, consistent with full year guidance of 1,100 tpd. Underground grades mined averaged 14.53 g/t Au in the second quarter, above annual guidance reflecting sequencing as mining was active in the high grade transverse stopes, which performed well.
Mill throughput increased to 1,130 tpd in the second quarter, a 16% increase compared to the prior year quarter, reflecting the completion of the Phase I expansion of the mill in 2018. Milling rates exceeded mining rates, as tonnes mined in the quarter were supplemented with existing surface stockpiles. Mill recoveries were 97% in the second quarter, in line with the prior year and guidance.
Financial Review
Island Gold generated revenues of $51.3 million in the second quarter, increasing 44% compared to the prior year period reflecting record ounces sold. For the first half of 2019, revenues of $95.1 million were $22.8 million higher than the prior year, primarily attributable to more ounces sold.
Cost of sales (includes mining and processing costs, royalties, and amortization expense) of $32.4 million, were 16% higher than the comparative period, reflecting more ounces sold. Cost of sales decreased 20% on a per ounce basis, driven by higher grades mined and lower amortization. Cost of sales for the first half of 2019 of $61.0 million increased 10% from the prior year period due to higher gold sales.
Total cash costs were $473 per ounce in the second quarter, a 19% improvement from the comparative quarter, driven by higher grades mined. Unit mining costs were CAD$158 per tonne, consistent with the prior year. Total cash costs were consistent with guidance in the quarter. For the first half of 2019, total cash costs of $484 per ounce were 15% lower than the prior year period due to higher mining rates and grade mined.
Mine-site AISC of $631 per ounce in the second quarter were below the full year guidance range of $730 to $770 per ounce, reflecting lower sustaining capital spending. Mine-site AISC for the first half of 2019 of $639 per ounce were 2% lower than the prior year period. Year-to-date, the Company has incurred $11.3 million of sustaining capital, or 30% of full year guidance (based on the mid-point). Sustaining capital will increase in subsequent quarters of 2019, which is expected to result in higher mine-site AISC in the second half of the year.
Total capital expenditures were $18.0 million in the second quarter, with spending focused on lateral development, mining equipment, and capitalized exploration. This included $6.2 million of sustaining capital and $11.8 million of growth capital (inclusive of capitalized exploration). For the six-month period, capital expenditures of $30.4 million were consistent with the prior year period.
Island Gold generated mine-site free cash flow of $11.7 million during the second quarter driven by record gold production, strong operating margins, and lower capital spending. Through the first half of 2019, Island Gold has generated $28.3 million of mine-site free cash flow. This strong performance is net of a significant ongoing investment in exploration focused on further expanding Mineral Reserves and Resources with $19 million budgeted for 2019.
Mulatos Financial and Operational Review
| Three Months Ended June 30, |
Six Months Ended June 30, |
|||||||||||
| 2019 | 2018 | 2019 | 2018 | |||||||||
| Gold production (ounces) | 36,300 | 50,600 | 75,200 | 96,600 | ||||||||
| Gold sales (ounces) | 40,116 | 49,326 | 76,205 | 93,985 | ||||||||
| Financial Review (in millions) | ||||||||||||
| Operating Revenues | $52.5 | $64.1 | $99.6 | $123.7 | ||||||||
| Cost of sales (1) | $35.8 | $49.2 | $69.6 | $92.8 | ||||||||
| Earnings from operations | $15.9 | $13.2 | $28.3 | $25.9 | ||||||||
| Cash provided by operating activities | $23.2 | $24.1 | $23.8 | $40.2 | ||||||||
| Capital expenditures (sustaining) (2) | $2.2 | $1.8 | $3.2 | $2.6 | ||||||||
| Capital expenditures (growth) (2) | $17.0 | $6.8 | $28.6 | $12.1 | ||||||||
| Capital expenditures (capitalized exploration) (2) | $— | $0.9 | $— | $2.0 | ||||||||
| Mine-site free cash flow, before changes in working capital | $4.0 | $14.6 | ($8.0 | ) | $23.5 | |||||||
| Cost of sales, including amortization per ounce of gold sold (1) | $892 | $997 | $913 | $987 | ||||||||
| Total cash costs per ounce of gold sold (2) | $725 | $795 | $734 | $791 | ||||||||
| Mine site all-in sustaining costs per ounce of gold sold (2),(3) | $815 | $854 | $812 | $848 | ||||||||
| Open Pit & Underground Operations | ||||||||||||
| Tonnes of ore mined – open pit (4) | 2,107,590 | 2,266,642 | 3,943,323 | 4,456,376 | ||||||||
| Total waste mined – open pit | 1,697,419 | 1,851,050 | 3,675,258 | 3,849,656 | ||||||||
| Total tonnes mined – open pit | 3,805,009 | 4,640,240 | 7,618,581 | 9,510,622 | ||||||||
| Waste-to-ore ratio (operating) | 0.81 | 0.82 | 0.67 | 0.86 | ||||||||
| Tonnes of ore mined – underground | — | 21,284 | — | 38,907 | ||||||||
| Crushing and Heap Leach Operations | ||||||||||||
| Tonnes of ore stacked | 1,962,436 | 1,802,109 | 3,837,992 | 3,552,580 | ||||||||
| Average grade of gold processed (5) | 0.94 | 0.88 | 0.96 | 0.86 | ||||||||
| Contained ounces stacked | 59,609 | 50,909 | 118,783 | 98,267 | ||||||||
| Mill Operations | ||||||||||||
| Tonnes of high grade ore milled | — | 31,485 | — | 61,874 | ||||||||
| Average grade of gold processed (5) | — | 5.94 | — | 7.00 | ||||||||
| Contained ounces milled | — | 6,012 | — | 13,929 | ||||||||
| Total contained ounces stacked and milled | 59,609 | 56,921 | 118,783 | 112,196 | ||||||||
| Average recovery rate | 61 | % | 89 | % | 63 | % | 86 | % | ||||
| Ore crushed per day (tonnes) – combined | 21,600 | 20,100 | 21,200 | 20,000 | ||||||||
(1) Cost of sales includes mining and processing costs, royalties and amortization.
(2) Refer to the “Non-GAAP Measures and Additional GAAP Measures” disclosure at the end of this press release and associated MD&A for a description and calculation of these measures.
(3) For the purposes of calculating mine-site all-in sustaining costs, the Company does not include an allocation of corporate and administrative and share based compensation expenses.
(4) Includes ore stockpiled during the quarter.
(5) Grams per tonne of gold (“g/t Au”).
Mulatos produced 36,300 ounces in the second quarter of 2019, bringing year-to-date production to 75,200 ounces, consistent with annual guidance. Second quarter production was down from the prior year period with mining from the San Carlos underground deposit having ceased in the third quarter of 2018.
The Company is currently mining from the Mulatos, Victor, La Yaqui Phase I and San Carlos open pits, having completed pre-stripping of the San Carlos pit at the end of the first quarter. Total ore tonnes mined and the waste-to-ore ratio in the second quarter were consistent with the prior year quarter. In the second half of the year, mining activities at La Yaqui Phase I will wind down. Offsetting this, the Company expects to begin stacking ore from Cerro Pelon later this year.
Total crusher throughput averaged 21,600 tpd for a total of 1,962,436 tonnes stacked in the second quarter at a grade of 0.94 g/t Au. Grades stacked were near the upper end of guidance as the Company resequenced mining activities, with an increased contribution from the San Carlos open pit in the second quarter.
The recovery ratio of ounces produced to contained ounces stacked was 61% in the quarter, lower than guidance, due to stacking higher grade ore at the end of the second quarter.
Financial Review
Second quarter revenues of $52.5 million were $11.6 million lower than the prior year quarter, primarily due to lower concentrate ounces sold with the completion of mining at the San Carlos underground deposit in September 2018. For the first half of 2019, revenues of $99.6 million were $24.1 million lower than the prior year.
Cost of sales (includes mining and processing costs, royalties, and amortization expense) were $35.8 million in the second quarter, lower than the prior year period due to a lower number of tonnes mined and ounces sold. Amortization expense of $167 per ounce was below the prior year period. Cost of sales for the first half of 2019 of $69.6 million were 25% lower due to lower tonnes mined and ounces sold.
Total cash costs of $725 per ounce in the second quarter were lower than the prior year quarter, as the 5% royalty payable to a third party ended in the first quarter of 2019 after Mulatos produced its two millionth ounce of gold. This reduced costs by $65 per ounce compared to the prior year period. In addition, total cash costs were below guided levels, driven by higher grades stacked in the quarter and the final settlement of low-cost ounces sold from concentrate. For the first half of 2019, total cash costs of $734 per ounce were 7% lower than the prior year period. The Company expects second half total cash costs to normalize to guided levels as low cost production from La Yaqui Phase I winds down.
Mine-site AISC of $815 per ounce in the second quarter were lower than the prior year quarter, consistent with the improvement in total cash costs. Mine-site AISC for the first half of 2019 of $812 per ounce were 4% lower than the prior year period due to similar factors. The Company expects second half mine-site AISC to be in line with full year guidance.
Capital spending in the quarter was focused on expansion projects at Mulatos, including Cerro Pelon and the leach pad expansion. Total capital spending for the quarter was $19.2 million, of which $2.2 million was sustaining capital. For the six-month period, capital expenditures of $31.8 million were $15.1 million higher than the prior year period due primarily to the construction of the Cerro Pelon mine.
Mulatos reported positive mine-site free cash-flow of $4.0 million in the second quarter, as stronger operating margins were partially offset by higher growth capital spending. Mine-site free-cash flow is expected to be neutral for the remainder of the year as construction of Cerro Pelon is completed.
El Chanate Financial and Operational Review
| Three Months Ended June 30, |
Six Months Ended June 30, |
|||||||||||
| 2019 | 2018 | 2019 | 2018 | |||||||||
| Gold production (ounces) | 4,400 | 10,100 | 10,200 | 23,900 | ||||||||
| Gold sales (ounces) | 4,376 | 10,683 | 10,411 | 23,776 | ||||||||
| Financial Review (in millions) | ||||||||||||
| Operating Revenues | $5.7 | $14.0 | $13.5 | $31.4 | ||||||||
| Cost of sales (1) | $5.8 | $16.1 | $13.5 | $32.7 | ||||||||
| Loss from operations | ($0.1 | ) | ($2.1 | ) | $— | ($1.3 | ) | |||||
| Cash provided by (used in) operating activities | $1.0 | ($0.4 | ) | $2.2 | $0.8 | |||||||
| Capital expenditures | $— | $0.2 | $— | $0.3 | ||||||||
| Mine-site free cash flow (2) | $1.0 | ($0.6 | ) | $2.2 | $0.5 | |||||||
| Cost of sales, including amortization per ounce of gold sold (1) | $1,325 | $1,507 | $1,297 | $1,375 | ||||||||
| Total cash costs per ounce of gold sold (2) | $1,234 | $1,404 | $1,210 | $1,279 | ||||||||
| Mine site all-in sustaining costs per ounce of gold sold (2),(3) | $1,257 | $1,442 | $1,220 | $1,304 | ||||||||
(1) Cost of sales includes mining and processing costs, royalties and amortization.
(2) Refer to the “Non-GAAP Measures and Additional GAAP Measures” disclosure at the end of this press release and associated MD&A for a description and calculation of these measures.
(3) For the purposes of calculating mine-site all-in sustaining costs, the Company does not include an allocation of corporate and administrative and share based compensation expenses.
El Chanate produced 4,400 ounces of gold in the second quarter through residual leaching, in line with budget. The Company expects to recover between 15,000 and 25,000 ounces in 2019, and will continue to leach until such time as the gold becomes uneconomic to recover.
Financial Review
Second quarter revenues of $5.7 million were lower than the prior year quarter due to fewer ounces sold, as mining and stacking ceased in 2018. Total cash costs, and mine-site AISC were $1,234 and $1,257 per ounce, respectively, for the second quarter, down significantly from the prior year period.
El Chanate generated $1.0 million of mine-site free cash flow in the quarter and $2.2 million year to date. The Company expects mine-site free cash flow to remain positive in 2019 before transitioning to reclamation activities.
Second Quarter 2019 Development Activities
Kirazlı (Çanakkale, Turkey)
The Company was granted the Operating Permit from the Turkish Department of Energy and Natural Resources in the first quarter of 2019 and has obtained all the major permits required for the start of construction at Kirazlı.
The Company continued to advance the project during the second quarter with development activities as follows:
- the mining services and earthworks contractor mobilized to site and commenced civil works
- integrated the construction management contractor, including oversight of project and contract management, implementation of heath and safety protocols, and project control
- completed site clearing and grubbing activities, and commenced tree clearing of the Kirazli open pit area
- advanced construction of the water reservoir and power line to site with both expected to be completed by the fourth quarter of 2019
- continued procurement of major purchase order packages, including the agglomerator, ADR, crushing circuit, and water treatment plant
- increased workforce to over 200 people on site, including over 80 direct employees with more than 70% coming from the local communities
- received the Regional Investment Incentive Certificate, which provides for various tax incentives, including VAT and customs duties exemptions during construction, and an 80% reduction in the statutory tax rate (until 40% of the initial capital has been recovered), thereby significantly reducing the effective tax rate over the mine life. The Company is in the process of applying for the Strategic Investment Incentive Certificate, which would further reduce the effective tax rate
During the second quarter of 2019, the Company spent $4.2 million at Kirazlı, bringing year-to-date spending to $7.1 million. The Company has budgeted up to $75 million in 2019. The remaining capital spending on the project is expected to occur in 2020, with initial production expected by the end of 2020.
As outlined in the 2017 Feasibility Study, Kirazlı has an expected 44% after-tax internal rate of return and is expected to produce over 100,000 ounces of gold during its first full year of production at mine-site all-in sustaining costs of less than $400 per ounce.
Mulatos District (Sonora, Mexico)
Cerro Pelon
The environmental impact assessment (“MIA”) and Change in Land Use permits for Cerro Pelon were received in the fourth quarter of 2018, with construction commencing shortly thereafter. Given its proximity to Mulatos’ infrastructure, ore from the Cerro Pelon open pit will be trucked to the existing heap leach circuit for crushing and processing. An independent crushing circuit will be dedicated to processing Cerro Pelon ore, thereby providing additional capacity at the Mulatos Complex. Cerro Pelon is a higher grade, high return project, and is expected to start contributing low cost production in 2020.
During the second quarter, construction activities ramped up and included the following key activities:
- ongoing construction of the haulage road from the Cerro Pelon open pit to the main Mulatos deposit, which was 90% complete by the end of June
- development of the haulage roads within the project pit area, which were 75% complete by the end of June
- completed civil works in advance of the crusher installation
- demobilized and transferred the crushing circuit from El Chanate, and commenced installation of the circuit at the Mulatos complex.
The crushing circuit, agglomorators, and overland conveyors are expected to be completed and commissioned by the end of the third quarter of 2019. Early stage stripping activities have commenced on the north-west pit, with mining rates expected to ramp up in the second half of the year.
The Company spent $7.9 million at Cerro Pelon in the second quarter, bringing year-to-date spending to $10.7 million. The Company has budgeted $25 million in 2019 for development of the project, with commercial production expected early in 2020.
La Yaqui Grande
The Company received approval of the environmental impact assessment (“MIA”) for La Yaqui Grande during the second quarter and the Change in Land Use permit in July 2019. The Company is in the process of completing detailed engineering to support the project design and economics. During the second quarter the Company spent $1.0 million on La Yaqui Grande, bringing year-to-date spending to $1.9 million.
Lynn Lake (Manitoba, Canada)
The Company released a positive Feasibility Study on the Lynn Lake project in December 2017 outlining average annual production of 143,000 ounces over a 10 year mine life at average mine-site all-in sustaining costs of $745 per ounce.
The Company continues to evaluate value engineering initiatives to enhance the project’s economics as detailed in the 2017 Feasibility Study (12.5% IRR at a $1,250 per ounce gold price; 18% IRR at a $1,400 per ounce gold price). Since the release of the 2017 Feasibility Study, the Company has undertaken a number of initiatives designed to improve the project economics. These include a detailed review of construction capital, the evaluation of various production scenarios and the inclusion of the results of more detailed engineering. The Company is in the process of incorporating results from the ongoing exploration program into an updated Feasibility Study.
Development spending in the second quarter of $0.7 million and year-to-date of $1.4 million was related to project optimization activities. The 2019 capital budget for Lynn Lake is $11.0 million, including $5.0 million for development activities and $6.0 million for exploration. Development spending will be focused on completing the updated Feasibility Study and baseline work in support of the Environmental Impact Study (“EIS”) for the project that will be submitted to satisfy Federal and Provincial environmental assessment requirements. The permitting process is expected to take approximately two years followed by two years of construction.
Second Quarter 2019 Exploration Activities
Island Gold (Ontario, Canada)
The 2019 exploration program continues to target three main areas within the Island Gold Deposit which extends over two-kilometres along strike. During the first half of 2019, the surface and underground exploration drilling programs focused on expanding the down-plunge and lateral extensions of the deposit with the objective of adding new near-mine Mineral Resources. Drill holes in the Main, Western, and Eastern Extension areas were testing high-grade, east-plunging shoots outside of existing Mineral Reserves and Resources.
The 2019 exploration budget includes 48,000 metres (“m”) of surface directional exploration drilling, 30,000 m of underground exploration drilling and 900 m of exploration drift development.
Surface exploration drilling
A total of 14 holes (10,413 m) were completed in the second quarter as part of the directional exploration drilling program. Directional drilling targeted areas peripheral to the Inferred Mineral Resource blocks below the 1,000 m level, with drill hole spacing ranging from 75 m to 100 m. The area that was targeted by the surface directional drill program extends approximately 2,000 m in strike length between the 1,000 m and 1,500 m elevation below surface.
Underground exploration drilling
During the second quarter of 2019, a total of 7,262 m of underground exploration diamond drilling was completed in 45 holes from the 340, 450, 620 and 840 levels. The objective of the underground drilling is to identify new Mineral Resources close to existing Mineral Resource or Reserve blocks. A total of 272 m of underground exploration drift development was completed on the 620 and 840 level during the second quarter of 2019.
Total exploration expenditures were $4.5 million of which $4.3 million was capitalized during the second quarter of 2019. Year-to-date, $7.8 million was spent of which $7.4 million was capitalized.
Mulatos District (Sonora, Mexico)
The Company has a large exploration package covering 28,972 hectares with the majority of past exploration efforts focused around the Mulatos mine. Over the last three years, exploration has moved beyond the main Mulatos pit area and focused on earlier stage prospects throughout the wider district.
In the second quarter of 2019, the Company invested $0.8 million in exploration activities within the Mulatos District. Spending in the quarter primarily related to mapping and re-logging, and administrative costs. Exploration efforts are expected to ramp up in the third quarter with near mine exploration and target generation.
Lynn Lake (Manitoba, Canada)
Surface exploration drilling continued at Lynn Lake during the second quarter of 2019, with a total of 1,972 m drilled in 7 holes. Drill holes were designed to test targets at the MacLellan and Gordon deposits with the objective of expanding Mineral Resources.
Regional exploration commenced during the second quarter of 2019 which included mapping, prospecting, till sampling, and soil sampling programs focused on a series of prospective targets across the Lynn Lake Greenstone Belt.
Spending in the second quarter totaled $1.4 million, bringing the year-to-date spend to $2.3 million. A total of $6.0 million comprised of 19,000 m of drilling is budgeted for the Lynn Lake project in 2019.
Review of Second Quarter Financial Results
During the second quarter of 2019, the Company sold 128,457 ounces of gold for total revenue of $168.1 million, consistent with the prior year period of $168.9 million as both the ounces sold and average realized price were in line with the prior year period. The Company’s realized gold price of $1,309 per ounce was consistent with the average London PM fix for the quarter.
Cost of sales were $131.1 million in the second quarter of 2019, a decrease of 13% compared to the prior-year period, driven by lower mining and processing costs, and lower royalties.
Mining and processing costs were $86.4 million compared to $101.3 million in the prior-year period. This was due to lower operating costs at Mulatos which drove down total cash costs for the quarter, and the completion of mining activities at El Chanate in the fourth quarter of 2018.
Consolidated total cash costs for the quarter were $699 per ounce compared to $832 per ounce in the prior year period. This 16% decline reflected low cost production growth at Island Gold, lower costs at Mulatos and declining higher-cost production at El Chanate. Total cash costs at Mulatos were significantly lower than guidance as the operation benefited from higher grades mined and unbudgeted sales of concentrate.
AISC were $926 per ounce in the quarter, a 7% decrease from the prior year period, primarily driven by lower total cash costs.
Royalty expense was $3.4 million in the quarter, lower than the prior year period of $6.3 million, as the 5% Mulatos royalty commitment ceased in the first quarter of 2019.
Amortization of $41.3 million in the quarter was lower than the prior year period expense of $42.4 million due to less ounces sold. On a per-ounce basis, amortization of $321 was consistent with the prior year period of $328, and consistent with guidance. The Company expects amortization to average $345 per ounce in 2019.
The Company recognized earnings from operations of $28.2 million in the quarter, higher than the prior year period due to lower mining and processing and royalty expense which drove stronger margins.
The Company reported net earnings of $23.6 million in the quarter, compared to a loss of $8.9 million in the same period of 2018, mainly driven by improved margins and the impact of foreign exchange on tax expense. On an adjusted basis, earnings of $17.7 million or $0.05 per share reflect adjustments for other gains and losses, as well as foreign exchange movements related to the Canadian dollar and Mexican Peso, which generated foreign exchange gains of $7.1 million recorded within both foreign exchange gain and deferred income taxes.
Associated Documents
This press release should be read in conjunction with the Company’s interim consolidated financial statements for the three-month period ended June 30, 2019 and associated Management’s Discussion and Analysis (“MD&A”), which are available from the Company’s website, www.alamosgold.com, in the “Investors” section under “Reports and Financials”, and on SEDAR (www.sedar.com) and EDGAR (www.sec.gov).
Reminder of Second Quarter 2019 Results Conference Call
The Company’s senior management will host a conference call on Thursday, August 1, 2019 at 11:00 am ET to discuss the second quarter 2019 results.
Participants may join the conference call by dialling (416) 340-2216 or (800) 273-9672 for calls within Canada and the United States, or via webcast at www.alamosgold.com.
A playback will be available until September 1, 2019 by dialling (905) 694-9451 or (800) 408-3053 within Canada and the United States. The pass code is 2634152#. The webcast will be archived at www.alamosgold.com
Qualified Persons
Chris Bostwick, FAusIMM, Alamos’ Vice President, Technical Services, who is a qualified person within the meaning of National Instrument 43-101 (“Qualified Person”), has reviewed and approved the scientific and technical information contained in this press release.
About Alamos
Alamos is a Canadian-based intermediate gold producer with diversified production from four operating mines in North America. This includes the Young-Davidson and Island Gold mines in northern Ontario, Canada and the Mulatos and El Chanate mines in Sonora State, Mexico. Additionally, the Company has a significant portfolio of development stage projects in Canada, Mexico, Turkey, and the United States. Alamos employs more than 1,700 people and is committed to the highest standards of sustainable development. The Company’s shares are traded on the TSX and NYSE under the symbol “AGI”.

- Northeast Forest Fire Update – July 22 - July 23, 2026
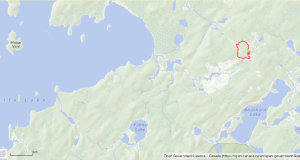
- Evacuation Order – Dryden 36 - July 22, 2026
- Schreiner joins call for public inquiry into wildfire response - July 22, 2026